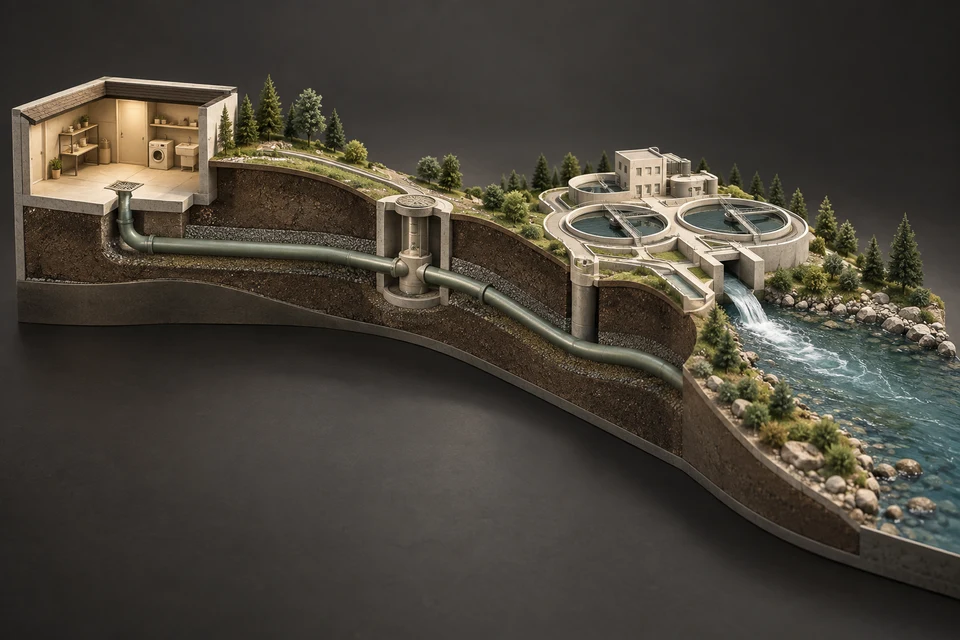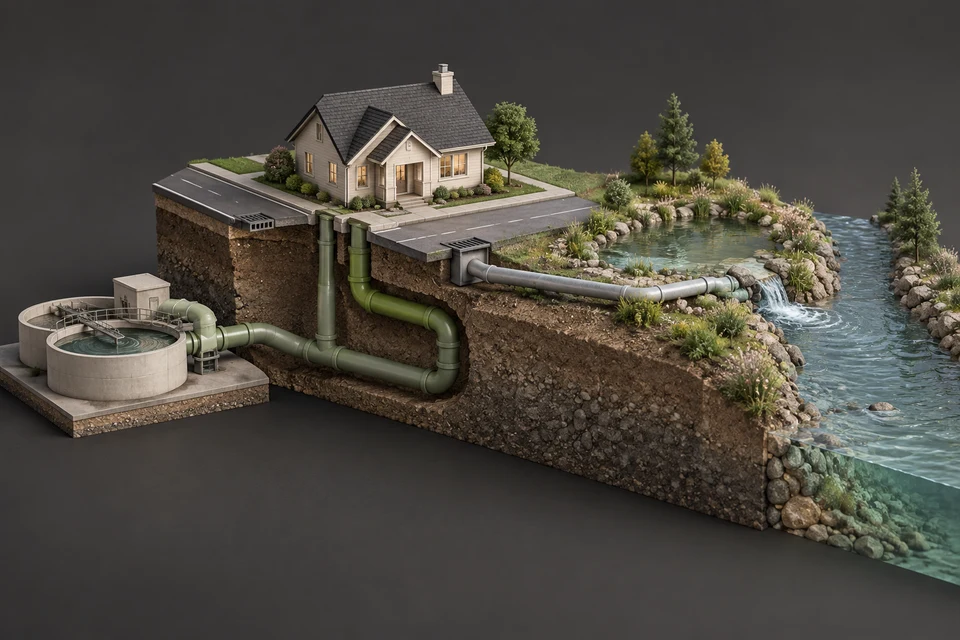
Calgary treats its wastewater at three City plants: Bonnybrook, Pine Creek and Fish Creek. The City's effluent data show Bonnybrook releasing about 405,000 cubic metres of treated water a day in 2025, roughly four-fifths of the total, with Pine Creek near 82,000 and Fish Creek near 28,000. Each plant screens, settles, biologically treats and UV-disinfects the flow before it reaches the Bow River.
- Averaged over 2025, the three plants released about 515,000 m³ of treated water a day; Bonnybrook alone accounted for about 79%.
- Pine Creek's effluent records begin in July 2008; since then Fish Creek's average flow has fallen from about 65,000 m³ a day to about 28,000.
- Plant flows peak on wet summer days, when rain and groundwater leak into sanitary pipes; Bonnybrook reached about 720,000 m³ on 22 July 2025.
- Each treatment stage maps to a parameter the City reports: suspended solids, biochemical oxygen demand, ammonia, phosphorus and, after UV, fecal coliforms.
- The City says Fish Creek can run at only about 30% of its capacity today; its upgrade is scheduled to finish at the end of 2031.
01 /Which plants treat Calgary's wastewater, and how much does each handle?
Three City plants take everything Calgary's sanitary system collects. The City's homeowner guide to the wastewater system names them, Bonnybrook, Fish Creek and Pine Creek, and the City's wastewater page says that together they meet the needs of more than one million Calgarians every day. The City's open data on treated effluent show how unevenly that work is shared.
| Year | Bonnybrook | Pine Creek | Fish Creek |
|---|---|---|---|
| 2008 | About 376,000 m³ | Records begin July 2008 | About 65,000 m³ |
| 2012 | About 364,000 m³ | About 71,000 m³ | About 33,000 m³ |
| 2016 | About 323,000 m³ | About 84,000 m³ | About 36,000 m³ |
| 2020 | About 344,000 m³ | About 87,000 m³ | About 31,000 m³ |
| 2024 | About 371,000 m³ | About 74,000 m³ | About 28,000 m³ |
| 2025 | About 405,000 m³ | About 82,000 m³ | About 28,000 m³ |
Bonnybrook dominates in every year. In 2025 it carried about 79% of the three-plant total, Pine Creek about 16% and Fish Creek about 5%. A cubic metre is 1,000 litres, so an average 2025 day returned roughly 515 million litres of treated water to the river. The City's Fish Creek project page lists some of the south Calgary communities that plant serves: Deer Ridge, Deer Run, McKenzie Lake, Parkland and surrounding neighbourhoods.
02 /How do plant flows change through the year?
They rise when it rains, even though Calgary's sanitary and storm systems are separate. In January and February 2025, Bonnybrook averaged about 371,000 m³ a day. Its highest days that year all fell in late June and July, topping out at about 720,000 m³ on 22 July and about 717,000 m³ on 21 June. Pine Creek's busiest 2025 day, about 198,000 m³, was more than double its annual average.
People do not flush twice as much in July. The extra volume is water that reached the sanitary system through defects and improper connections: cracked service lines and joints, loose manhole lids in flooded streets, and yard drains or sump pumps tied into the sanitary side. Engineers call it inflow and infiltration. Part of it enters through private service lines, which is one reason a cracked lateral is a public problem as well as a private one. The mechanism is covered in sanitary vs storm sewers in Calgary.
The City has also published in-pipe measurements. Its Collection System Levels and Flows dataset holds seasonal readings, typically May to September, from flow meters in the sanitary system between 2005 and 2013. Both datasets are described in Calgary wastewater data and monitoring.
03 /What does each treatment stage remove, and how is it measured?
Treatment is a sequence of separations, and the City's effluent results track what each separation leaves behind. The stage descriptions below follow the City's homeowner guide; the right-hand column links each stage to the parameters in the City's published data.
| Stage (City homeowner guide) | What it removes or changes | Related parameter in the City's effluent data |
|---|---|---|
| Headworks: screens and grit tanks | Rags, wipes, plastics, toys, sticks and heavy grit, sent to landfill | Not measured in effluent; protects the stages downstream |
| Primary clarifiers (about three hours) | Settleable solids sink as sludge; fats, oils and grease are skimmed off | Total suspended solids |
| Bioreactors | Micro-organisms with added air consume organic matter and nutrients such as ammonia and phosphorus | Biochemical oxygen demand, ammonia, nitrogen species, total phosphorus |
| Secondary clarifiers | Micro-organisms settle out; some return to the bioreactors | Total suspended solids |
| Cloth disk filters (at some plants) | Further solids, phosphorus and algae | Total suspended solids, total phosphorus |
| UV disinfection | Ultraviolet light alters microbes' DNA so they cannot reproduce | Fecal coliforms at the after-UV sampling sites |
Averaged over 2025, the City's data show total phosphorus of about 0.21 mg/L at Pine Creek and about 0.5 mg/L at Bonnybrook and Fish Creek, and carbonaceous biochemical oxygen demand of about 2.5 mg/L at Pine Creek, 3.4 at Bonnybrook and 8.0 at Fish Creek. Plants differ in design and approvals, so compare each with its own history rather than ranking them. The City's guide says its laboratories sample every stage, every day of the year, to meet provincial standards.
04 /What happens to the solids and the energy they contain?
Sludge from the clarifiers becomes a resource. According to the City's homeowner guide, it is thickened, partly fermented to feed the bioreactors, and then digested in warm, oxygen-free tanks for about 25 days. Digestion converts organic matter into water, methane and carbon dioxide, and the City uses the methane as fuel for heat and electricity at its plants.
| Season | Route | Duration | End use |
|---|---|---|---|
| Spring and summer | Shepard Lagoons | About six weeks of settling | Applied to farmland through the Calgro program |
| Fall and winter | Dewatering facility at Bonnybrook, then composting | About 60 days of composting | Category A compost |
The City says Calgro, which has run for more than 30 years, supplies nutrients for crops such as cereal grains, trees, sod, small oilseeds and dried legumes, and that the water pressed out during dewatering returns to the start of treatment.
05 /How are the plants being upgraded?
The biggest published change is at Fish Creek. The City's project page states that the plant can currently run at only about 30 per cent of its capacity, and that the upgrade will let it run safely at full capacity, improve treatment for regulatory compliance and add odour control. The page also estimates odour levels about five times lower at the plant boundary and three times lower at the nearest homes once work is complete.
| Phase | Timing |
|---|---|
| Design | 2023 to 2026 |
| Construction | 2025 to 2030 |
| Completion | End of 2031 |
Schedules for projects this size move, so check the City's page for the current plan. Odour from the plants, and the biofilters planned at Fish Creek, are discussed in sewer smells in Calgary. The flow table above is a useful companion: as Fish Creek's capacity returns, its share of the south's flow may change, and the effluent data will show it.
06 /Why does the treatment plant matter to a homeowner?
Because the plant only sees what survives the trip, and your service line is the first part of that trip. Under the ownership split the City publishes, the street-side length of each connection is municipal and the house-side length is yours. A private line that leaks lets groundwater in, adding to wet-weather flows at the plant, and a private line that clogs backs sewage into a basement before anything reaches treatment. Bonnybrook also receives flow from neighbouring municipalities, including Airdrie, whose new connection is described in the Airdrie–Calgary wastewater pipeline. What happened when a pipe carrying raw sewage to Bonnybrook failed under the river in 2025 is covered in sewage leaks and the Bow River.
- Toilets: the City's rule is pee, poo and toilet paper only; wipes, floss and hygiene products go in the garbage.
- Kitchens: fats, oils and grease go in the green cart.
- Medicines: return them to a pharmacy.
- Your line: know what the City recorded for your connection with the Service Line Lookup, and see the full path in how Calgary's sewer system works.
For practical help when something backs up, CalgarySewers.com is this network's Calgary help desk. If you want your own line inspected, request quotes.
FAQQuestions people ask
How many wastewater treatment plants does Calgary have?
Three: Bonnybrook, Fish Creek and Pine Creek. The City says together they meet the wastewater needs of more than one million Calgarians each day.
Which is Calgary's largest wastewater treatment plant?
Bonnybrook, on the City's own effluent data: about 405,000 cubic metres a day on average in 2025, roughly 79% of the three-plant total.
Where does Calgary's treated wastewater go?
Into the Bow River, after ultraviolet disinfection. The City says it samples at all stages of treatment to meet standards set by the provincial government.
Why do Calgary's treatment plant flows rise in summer?
Rain and groundwater enter sanitary pipes through cracks, open joints, loose lids and improper connections. Bonnybrook's highest 2025 flows came in late June and July, close to double its winter average.
Is the Fish Creek treatment plant being upgraded?
Yes. The City says the plant can currently run at only about 30% of its capacity and lists design from 2023 to 2026, construction from 2025 to 2030 and completion at the end of 2031.
NETWORKGo deeper across the HAUSE Sewer network
Commercial and municipal sewer jetting: combination trucks, interceptors and schedules
Commercial sewer jetting explained: jet-vac combination trucks, high-flow mains cleaning, restaurant grease lines, interceptors and confined space rules.
SewerCleaners.caWhat causes sewer backup, and how to tell which cause is yours
What causes sewer backup: roots, grease, wipes, sags, broken pipe, frozen lines and rain-overloaded city sewers, plus how to tell which one caused yours.
SewerInspector.caHow long a sewer scope takes, from booking to the report
How long a sewer scope inspection takes: typical time on site, what adds time, how far ahead to book, and when to expect the video and the written report.
SOURCESSources and further reading
- City of Calgary — Homeowner Water Guide: Wastewater Treatment System
- City of Calgary — Wastewater treatment system
- City of Calgary — Fish Creek Wastewater Treatment Plant upgrades
- City of Calgary Open Data — Wastewater Treatment Plants Effluent Water Quality
- City of Calgary Open Data — Collection System Levels and Flows