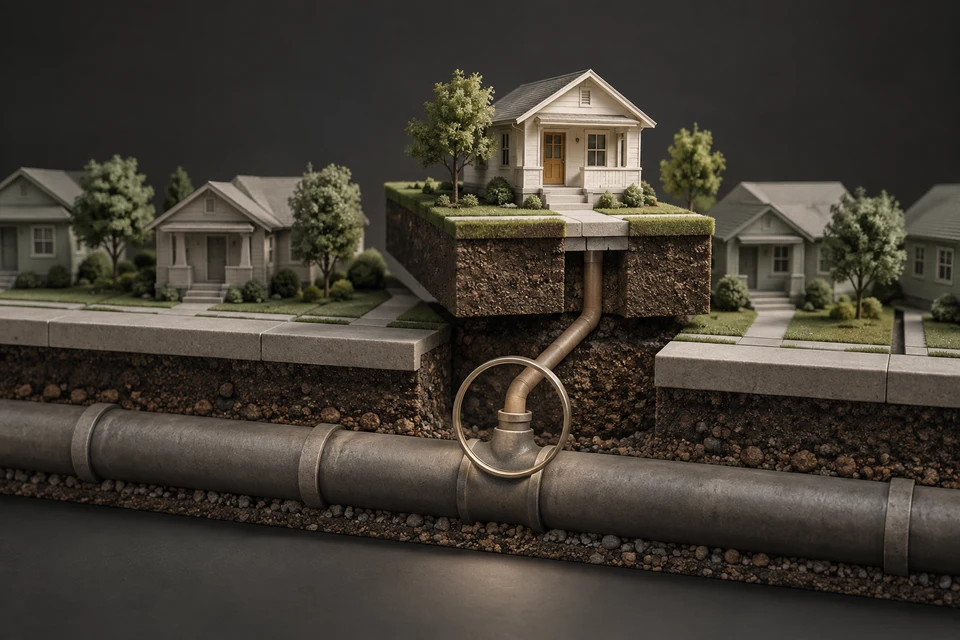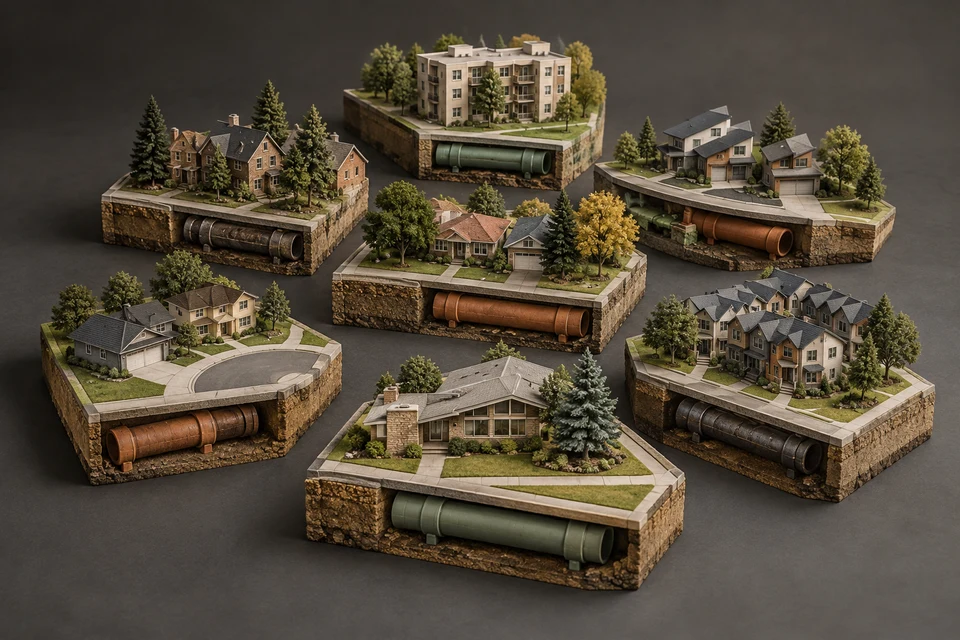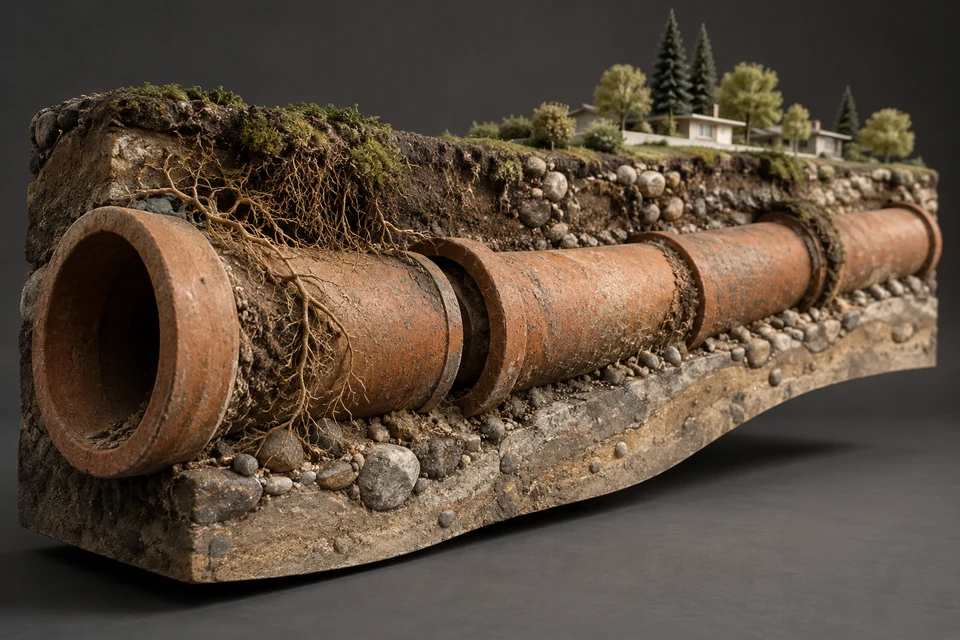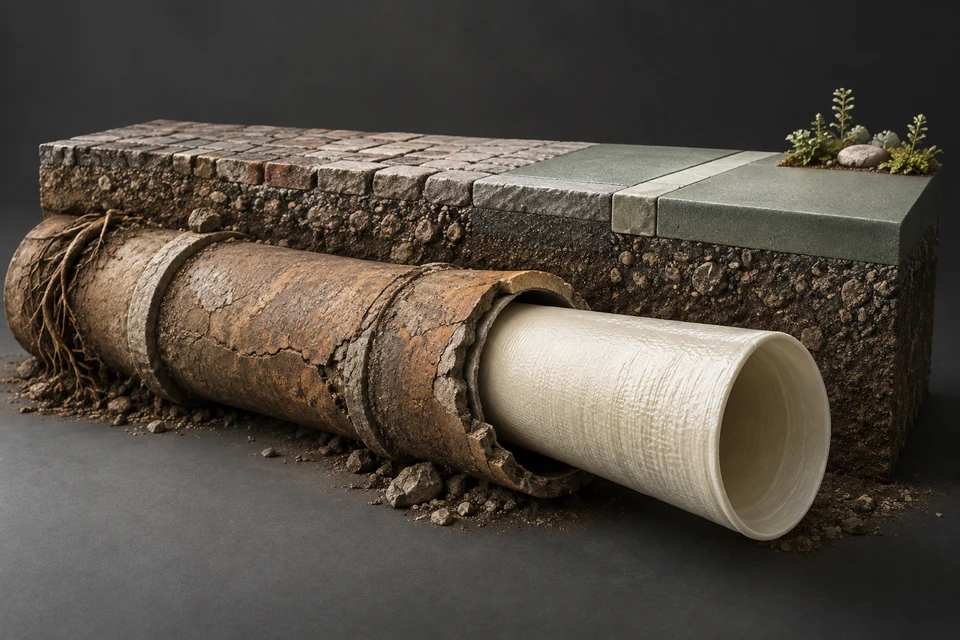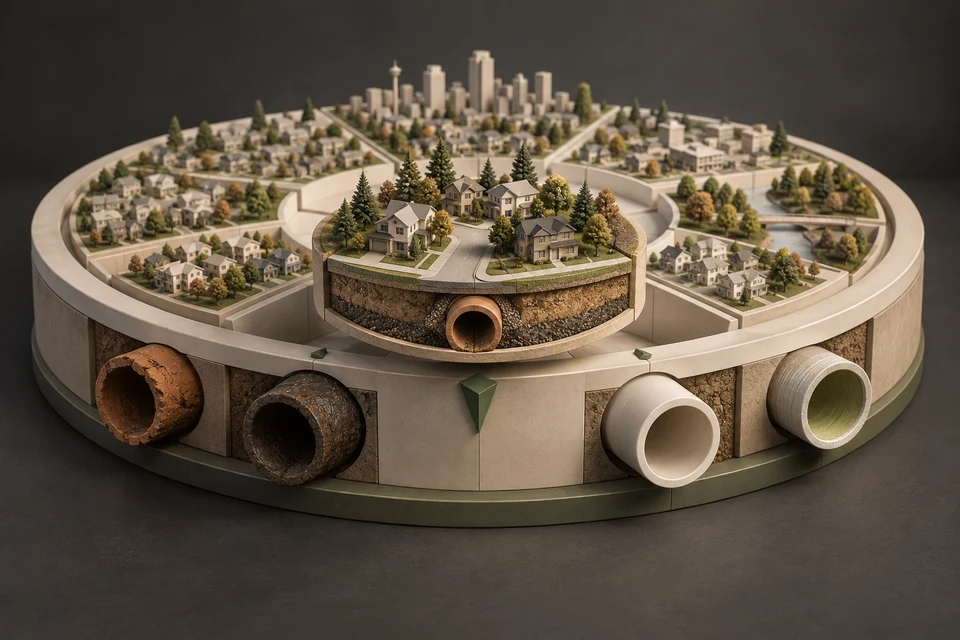
The Community Sewer Atlas is a searchable, sortable table of 218 Calgary communities built from the City's Public Sanitary Service Lines open data. For each community it shows the number of service lines, the median install year and the shares coded clay tile, cast iron, PVC, relined and pre-1960. Select a community to see its decade histogram, material mix and the City's structure class. City-owned portion only.
- The atlas summarizes 367,397 City-side service lines into 218 communities, using the community each line starts in.
- Columns: community, service lines, median install year, % TIL, % cast iron, % PVC, % relined and % pre-1960; any column can be sorted.
- Filters narrow the table by the City's sector (eight sectors) and community structure class.
- A community card shows the decade histogram, the full material mix and the structure class.
- Every figure describes the City-owned segment only; the private pipe on each lot can be a different material and age.
Community Sewer Atlas
01 /What is the Community Sewer Atlas?
The atlas turns the City of Calgary's record of every public sanitary service line into one row per community. It answers questions a single address cannot: is my street typical for my community, which communities were built with the City's TIL (tile) code, generally clay tile, and where has the City already relined its side of the connection?
The source is the City's *Public Sanitary Service Lines* dataset (xesp-3jc3), which lists 367,397 active service lines with material, installed date, diameter, public-side length and building type. This site joined each line to the City's *Community District Boundaries* dataset (surr-xmvs) and summarized the result on 2026-09-24. The table is loaded from that summary file; the atlas does not query the City live, so it reflects the snapshot date shown in the method notes.
02 /What does each column mean?
Each row is one community. The table can be searched by name and sorted on any column, ascending or descending.
| Column | What it measures | How to read it |
|---|---|---|
| Community | The City's community name | Combined names (for example Albert Park/Radisson Heights) follow the City's boundary file |
| Service lines | Number of City-side lines assigned to the community | Larger numbers give steadier percentages |
| Median install year | The middle installed date on the community's records | Half the lines are older and half newer; a recent median in an old area usually signals redevelopment |
| % TIL | Share coded TIL | The City's TIL (tile) code, generally clay tile; the code is not defined in the metadata |
| % cast iron | Share coded CI | Common on 1950s and 1960s installs in some western and northern communities |
| % PVC | Share coded PVC | Modern plastic; dominant after 1980 |
| % relined | Share coded CIPP | A cured-in-place liner inside an older City-side pipe; the date is usually the relining date |
| % pre-1960 | Share with an installed date before 1960 | Mostly inner-city and 1950s communities |
Sorting is where the atlas earns its keep. Sort by % TIL and Maple Ridge (99.1% of 808 lines), Rundle (97.1% of 2,312) and Marlborough Park (96.9% of 2,138) rise to the top. Sort by % relined and Highwood (22.1%), Glendale (19.9%) and University Heights (19.9%) lead. Sort by median install year, oldest first, and Rosedale (1950), Scarboro (1952) and a cluster of 1954 communities appear: Hounsfield Heights/Briar Hill, Inglewood, Ramsay and Upper Mount Royal.
03 /What do you see when you select a community?
Selecting a row opens a community card with three views that the table cannot show on one line.
- Decade histogram: the number of City-side lines installed in each decade, which shows whether a community was built in one burst or has been redeveloped over time.
- Material mix: every material code recorded in the community with its count, including the less common codes such as TP, OTHER, PLA, HDPE and lines with no material recorded.
- Structure class: the label the City's boundary file gives the community (for example 1950s, 1960s/1970s, Inner City or Building Out), shown next to the actual install dates.
Take Abbeydale as an example. Its row shows 1,791 lines, a median install year of 1978 and 86.3% TIL. Its card shows 1,359 lines installed in the 1970s and 387 in the 1980s, with 1,545 TIL and 230 PVC records. Yet the City's boundary file places Abbeydale in the 2000s structure class. The card shows both, and the difference is a reminder that the structure class is a City planning label, not a construction date.
04 /How do the sector and structure filters work?
Two filters narrow the table. The sector filter uses the eight sectors in the City's boundary file: Centre, North, Northeast, East, Southeast, South, West and Northwest. The structure filter uses the City's community structure classes. Filters combine, so you can ask for, say, Northwest communities in the 1960s/1970s class.
| Sector | Communities | Service lines | % TIL | % CI | % PVC | % relined | % pre-1960 |
|---|---|---|---|---|---|---|---|
| Centre | 56 | 42,507 | 1.8 | 14.9 | 39.0 | 3.4 | 43.4 |
| West | 24 | 32,313 | 14.3 | 5.0 | 68.9 | 2.2 | 14.4 |
| East | 12 | 15,015 | 42.0 | 6.6 | 32.0 | 1.9 | 2.8 |
| Northwest | 21 | 50,666 | 28.7 | 4.2 | 60.8 | 1.2 | 2.9 |
| South | 44 | 74,186 | 33.3 | 0.4 | 62.4 | 0.6 | 5.0 |
| North | 23 | 54,812 | 10.7 | 0.3 | 84.3 | 0.8 | 1.9 |
| Northeast | 24 | 50,097 | 32.2 | 0.1 | 65.6 | 0.2 | 0.7 |
| Southeast | 14 | 47,526 | 2.6 | 1.4 | 93.7 | 0.2 | 1.6 |
The Centre sector holds the oldest records by far, with 43.4% of its lines dated before 1960, and the most relining. The East sector has the highest clay tile share. The Southeast is the newest, with 93.7% PVC. For the same view by structure class, and a guide to each era, see Calgary communities.
05 /How was the atlas built?
The method notes in the tool are the same as those in this site's summary file. They matter because a few choices shape every number.
- Source: City of Calgary open data, *Public Sanitary Service Lines* (xesp-3jc3, 367,397 active service lines, rows updated 2026-09-01) joined to *Community District Boundaries* (surr-xmvs). Licence: Open Government Licence – City of Calgary. Fetched 2026-09-24.
- Each service line is assigned to the community containing its first mapped point. A line that starts on one side of a boundary is counted there.
- Communities with fewer than 20 service lines are omitted, which is why the atlas has 218 communities rather than every name in the boundary file.
- Material codes are the City's. TIL, TP, PLA and OTHER are not defined in the City's metadata. TIL is generally read as clay tile; TP appears almost entirely on 1950s and early 1960s installs.
- The installed date is the date on the City's record. Pre-1950 records are mostly coded OTHER, and a CIPP date is usually the relining date.
- The data covers only the City-owned portion. The private portion can be a different material and age. Large commercial and multi-family services are not included.
- The City invites corrections through 311.
Percentages are shares of each community's lines, rounded to one decimal place. Because the sector and structure summaries above add up only the 218 atlas communities, their totals are slightly smaller than the citywide 367,397.
06 /How should you use what the atlas shows?
Use the atlas for context, not for a verdict on one house. A community that is 95% clay tile on the City side tells you that houses there were serviced in the clay tile era; it does not tell you whether a given private line has been replaced, lined or never touched.
- Find your community
Search by name, then open its card and look at the decade histogram and material mix.
- Look up your own address
Use the Service Line Lookup to see whether your City-side record matches the community pattern.
- Read the era guide
Each era has its own pattern: the clay tile belt, 1950s communities, the inner city and 1980s to 2020s communities.
- Camera the private side if the era is older
In pre-1980 communities, a camera inspection is the only way to see the pipe you own. If you want prices for that or for repairs, request quotes.
Researchers, community associations and journalists can cite the table directly. Please credit it as “HAUSE analysis of City of Calgary open data (Public Sanitary Service Lines, 2026-09-24)” and keep the City-owned-portion caveat with any number you quote.
FAQQuestions people ask
Why are some Calgary communities missing from the atlas?
Communities with fewer than 20 City-side service lines are omitted, and the dataset excludes large commercial and multi-family services. Mostly industrial, downtown or brand-new areas can therefore be missing or small.
Does a high clay tile percentage mean my sewer line is clay?
Not necessarily. The atlas describes the City-owned segments in your community. Your private pipe may be clay, may have been replaced or lined, and can differ from the City side. A camera inspection answers the question for one house.
What is the City's community structure class?
It is a classification in the City's Community District Boundaries data, with labels such as 1950s, 1960s/1970s, Inner City and Building Out. It does not always match install dates; Abbeydale is labelled 2000s but its median City-side install year is 1978.
Why does an old community have a recent median install year?
Redevelopment replaces services. Altadore (median 2007), Parkdale (2005) and Mount Pleasant (2004) are established communities where infill and renewal have added many newer PVC or relined records.
How often is the atlas updated?
The atlas is a snapshot fetched on 2026-09-24. The City lists its service line dataset as updated monthly, so the Service Line Lookup, which queries live, can show newer records than the atlas.
Can I cite the atlas numbers?
Yes. Credit them as a HAUSE analysis of City of Calgary open data (Public Sanitary Service Lines, 2026-09-24), link the City dataset, and state that the figures cover only the City-owned portion of each line.
NETWORKGo deeper across the HAUSE Sewer network
Sewer pipe materials by construction era, and what each looks like on camera
Sewer pipe materials by era in Canadian homes: clay, cast iron, Orangeburg, concrete, ABS and PVC, how each one fails and what it looks like on camera.
PipeCleaning.caWhat pipe do I have? Identify your drain pipe material
What pipe do I have? Identify a drain pipe from its look, joints, markings and house age, with a confidence rating, safe cleaning methods and camera advice.
SewerJetting.caJetter power calculator: hydraulic horsepower, rig class and line fit
Jetter power calculator: enter psi, gpm and line size to get hydraulic horsepower, the rig class your flow implies, the usual pairing and safety flags.