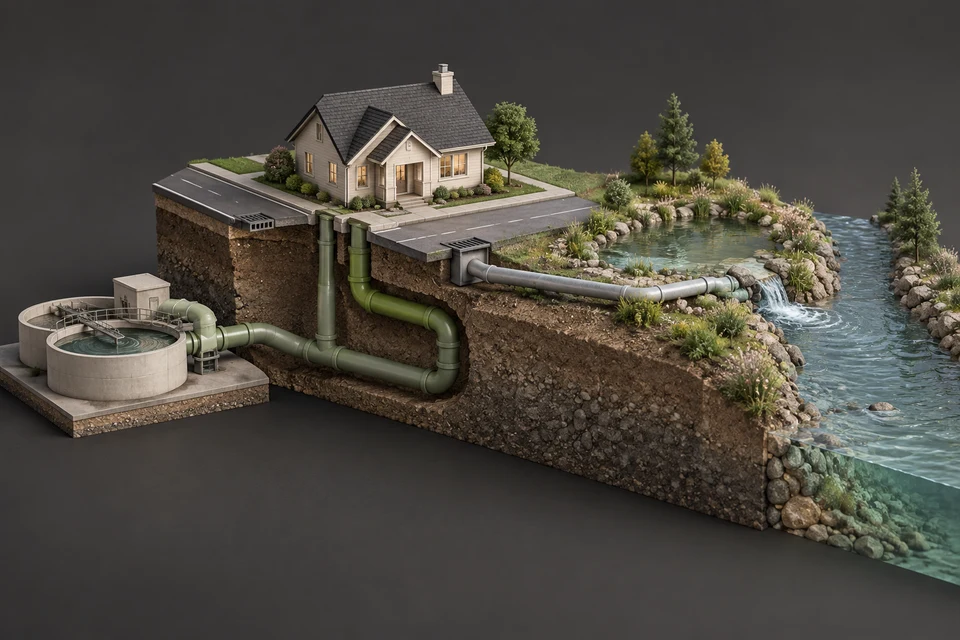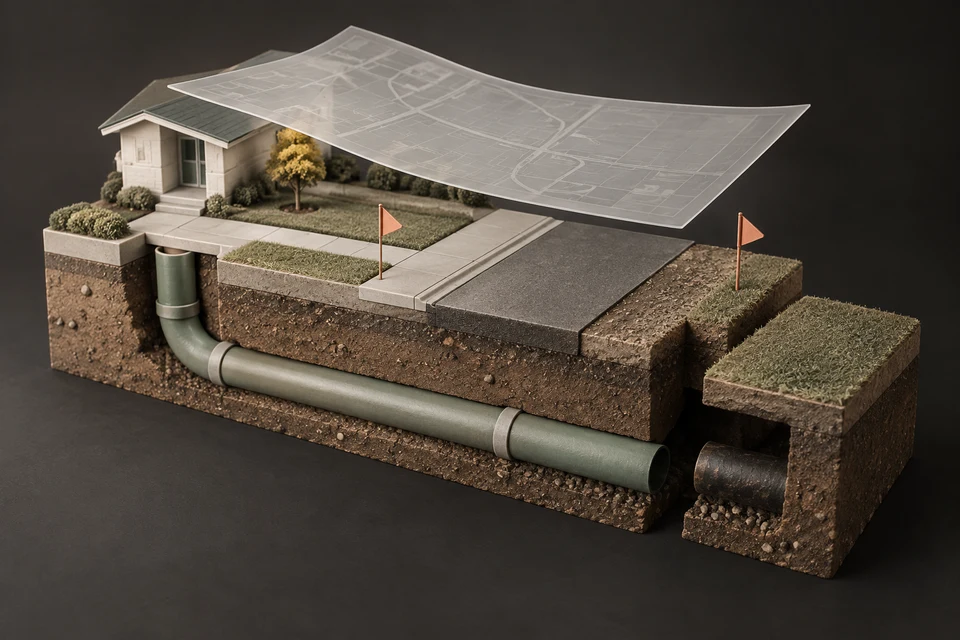
Calgary's wastewater is measured in three public ways. The City publishes daily treatment plant effluent results and flows from 2007 onward. Provincial and federal programs test Calgary wastewater for COVID-19, influenza, RSV and other pathogens and post trends on public dashboards. And the City's service line dataset records the material and age of every residential sewer connection's public segment.
- The City's effluent dataset holds laboratory and flow results for all three treatment plants from 2007, reported monthly to Alberta Environment and Protected Areas.
- In 2025 the three plants released an average of about 515,000 cubic metres of treated water a day, about 79% of it from Bonnybrook.
- Alberta's wastewater surveillance began in 2020 with COVID-19 and expanded to influenza, RSV and other pathogens; it is managed by Alberta Health and Alberta Precision Laboratories.
- Wastewater virus data show community trends; the federal dashboard notes it cannot identify single cases or households.
- The service line dataset describes only the City-owned segment of each connection; the private segment can be a different material and age.
01 /What wastewater data does Calgary publish?
Calgary's wastewater data fall into three families: what leaves the treatment plants, what the wastewater says about community health, and what the pipe network is made of. Each answers a different question and has different limits.
| Dataset or dashboard | Publisher | What it covers | Refresh |
|---|---|---|---|
| Wastewater Treatment Plants Effluent Water Quality | City of Calgary open data | Lab results and daily flows for treated effluent at Bonnybrook, Fish Creek and Pine Creek, 2007 to present | Monthly |
| Public Sanitary Service Lines | City of Calgary open data | Material, installed date, diameter, length and building type for 367,397 City-side service lines | Monthly |
| Collection System Levels and Flows | City of Calgary open data | Readings from area-velocity flow meters in the sanitary system, mostly May to September, 2005 to 2013 | Irregular (historical) |
| Alberta wastewater surveillance dashboard | Centre for Health Informatics, with Alberta Health and Alberta Precision Laboratories | COVID-19, influenza, RSV and other pathogens in Alberta municipalities' wastewater | Regular updates |
| National wastewater monitoring dashboard | Government of Canada (Health Infobase) | COVID-19, flu, RSV and mpox signals; Calgary added to the joint program in 2024 | Weekly averages |
02 /What do the treatment plant effluent data show?
They show how much treated water each plant releases to the river and what is left in it. The City describes the dataset as results that are reported monthly to Alberta Environment and Protected Areas, covering laboratory and flow data for the plants' treated effluent from 2007. Laboratory results come from daily 24-hour composite samples, except fecal coliforms, which come from grab samples, and the City's laboratory is accredited to the ISO/IEC 17025 standard.
The parameters include ammonia as nitrogen, biochemical oxygen demand, fecal coliforms, effluent temperature, mercury, nitrite plus nitrate, total Kjeldahl nitrogen, total phosphorus, total suspended solids and total effluent flow to the river. Sampling sites are listed per plant, with separate after-UV sites for disinfection results.
| Plant | Average effluent flow | Total phosphorus | Total suspended solids |
|---|---|---|---|
| Bonnybrook | About 405,000 m³/day | About 0.49 mg/L | About 6.9 mg/L |
| Pine Creek | About 82,000 m³/day | About 0.21 mg/L | About 3.5 mg/L |
| Fish Creek | About 28,000 m³/day | About 0.51 mg/L | About 12.9 mg/L |
The river downstream has its own record too: the City's watershed sampling data, used in sewage leaks and the Bow River, show how bacteria levels change as the Bow crosses the city. Read these with care. Plants use different processes and operate under their own approvals, so the right comparison for any plant is its own history and its own limits, not the other plants. Annual averages also hide daily variation: Bonnybrook's flow ranged from winter days near 371,000 m³ to a peak of about 720,000 m³ on 22 July 2025. The treatment steps behind the numbers are described in Calgary's wastewater treatment plants.
03 /How is Calgary's wastewater tested for COVID, flu and RSV?
Samples of wastewater collected at treatment plants are tested for the genetic material of viruses shed by people in the area the plant serves. The University of Calgary describes the provincial program as beginning in 2020, tracking COVID-19 in Alberta municipalities by testing wastewater for genomic traces of the virus, then expanding to influenza, RSV and other pathogens. It says the program is now managed by Alberta Health and Alberta Precision Laboratories and that results are shared on the Centre for Health Informatics dashboard. Since 2023 the work has also included substances of potential abuse, such as opioids.
Calgary also appears in federal reporting. The Government of Canada's national wastewater monitoring dashboard covers COVID-19, flu, RSV and mpox, presents most results as weekly averages, and lists Calgary among the cities added to its joint collection program in 2024.
- Trend over level: a rising line over two or three weeks means more than any single week's value.
- Sewershed, not neighbourhood: each plant serves a large area, so a signal cannot be pinned to a street.
- Dilution matters: rain entering the sanitary system dilutes samples, and many programs adjust results to account for it.
- Lag and revision: laboratory processing takes days, and recent points can change as data are finalized.
04 /What do the service line records add?
They describe the network itself. The City's *Public Sanitary Service Lines* dataset records the public segment of every residential and small-building connection: 367,397 lines with a median install year of 1995. Material codes tell the story of Calgary's growth, from records coded OTHER before the mid-1950s, through a clay tile era that peaked in the 1970s, to PVC from the 1980s on.
Two rules apply every time these numbers are used. The records stop at the property line, so they say nothing reliable about the owner's segment, which may be a different material laid in a different year. And four of its codes, TIL, TP, PLA and OTHER, are not defined in the City's metadata. The Community Sewer Atlas summarizes the records by community, and how to read Calgary's service line records walks through every field.
05 /What about flow in the sewer pipes themselves?
The City has published historical in-pipe measurements. Its *Collection System Levels and Flows* dataset contains data collected in the sanitary sewer system by area-velocity open-channel flow meters, with raw and edited level, velocity and flow values and a flag for finalized, quality-checked records. The metadata describe it as seasonal data, typically May to September, covering 2005 to 2013 with no 2006 data, and warn that the CSV download is about 4.58 GB.
Datasets like this are what engineers use to size pipes and find where rain gets into the sanitary system. For homeowners, the practical lesson is the same one the plant flows teach: wet weather raises sanitary flows, and the defects that let water in are often in private service lines as well as public pipes. Sanitary vs storm sewers in Calgary explains the mechanism.
06 /How can residents use this data responsibly?
- Cite the source and date
Name the dataset, the publisher and the date you retrieved it. The City's open data is published under its open data terms of use.
- Keep the limits attached
Say that service line figures cover only the City-owned portion, that virus data are community-level trends, and that effluent values vary by plant and day.
- Avoid false precision
Round flows and concentrations, and do not rank plants or communities on a single number.
- Report errors
If you find a record that looks wrong, such as a material code on your own service line, the City invites corrections through 311.
If you are curious about your own connection rather than the city as a whole, start with the Service Line Lookup. If the record shows an older material and you want your private side checked, you can request quotes for a camera inspection.
FAQQuestions people ask
Where can I see Calgary's wastewater COVID data?
Provincial results are shared on the Centre for Health Informatics dashboard, and the Government of Canada's national wastewater monitoring dashboard includes Calgary, added to its joint collection program in 2024.
Does Calgary test wastewater for the flu?
Yes, as part of Alberta's wastewater surveillance program, which began with COVID-19 in 2020 and expanded to influenza, RSV and other pathogens. The national dashboard also reports flu signals.
Can wastewater data show whether my street has COVID?
No. Each plant serves a large area, and the federal dashboard notes that wastewater monitoring cannot identify single cases or households.
How much wastewater does Calgary treat each day?
Based on the City's effluent flow data, the three plants released an average of about 515,000 cubic metres of treated water a day in 2025, with higher totals on wet summer days.
Is Calgary's wastewater data free to use?
The City's datasets are published on its open data portal under its open data terms of use. Dashboards run by other governments and universities have their own terms.
NETWORKGo deeper across the HAUSE Sewer network
Sewer Maintenance Planner
Sewer Maintenance Planner: a suggested cleaning and camera inspection interval plus a 12-month checklist based on your house, pipes, trees and history.
SewerInspector.caSewer scope inspections in Edmonton: what to expect and who to call
Sewer scope and sewer line inspection in Edmonton: what mature and newer neighbourhoods show on camera, cold and clay soils, elms, EPCOR and 311 checks.
PipeCleaning.caHow long cast iron drain pipes last, and when to repair, line or replace
How long do cast iron drain pipes last? Why they rust and crack, how to judge remaining life, and when a repair sleeve, lining or replacement is right.
SOURCESSources and further reading
- City of Calgary Open Data — Wastewater Treatment Plants Effluent Water Quality
- City of Calgary Open Data — Collection System Levels and Flows
- University of Calgary — Wastewater monitoring
- Government of Canada — National wastewater monitoring dashboard: about
- City of Calgary Open Data — Public Sanitary Service Lines (xesp-3jc3)